INDIA: IT’S MARKETS & ECONOMY ON THE RISE
By G. R. Harrison (2014)
 INDIA is the next of the BRIC (Brazil, Russia, India and China) nations we’ll examine.
What we’ve been looking for are signs on how the stock market and currencies for several nations.
Most importantly, we’re drawing our conclusions directly from charts that pertain to a nation’s stock market and it’s currency.
Unlike some of the recent nations we’ve analyzed, India is going it’s own way independently from the other BRIC nations.
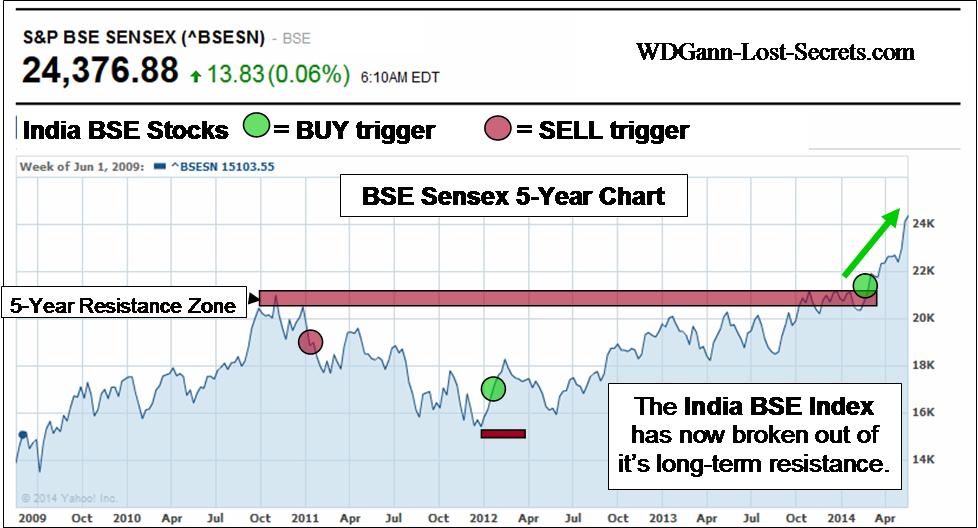
The Indian Bombay Stock Exchange bottomed at the end of 2012 and has been rising ever since gaining over 50% in value over that time to present.
More importantly, this rise in the BSE Sensex index appears to be ONLY JUST BEGINNING.
The first chart shows the index for the last 5-years along with trigger signals and the Resistance ceiling for prices over this long period. Prices have now broken well past this former resistance level and soared upwards. When prices are contained within a range for a long period, a break-out will have considerable momentum behind it.
That’s the case here. But, it gets even better . . .
 The next chart shows the BSE Sensex Index over a 10-Year period.
This is a very long time period for markets.
Note that the horizontal red bar shows how price resistance has been contained over this long 10-year period by the 20,000 price area.
Also notice that we’ve now blown by this in the upwards direction.
History and the study of price movements (as WD Gann always advocated) shows that such price breakouts often have preceded enormous market moves in price.
Looking around the World, this market seems to offer tremendous promise for growth and prosperity.
Let’s see how India’s currency is poised during this Stock Market & economic boom.
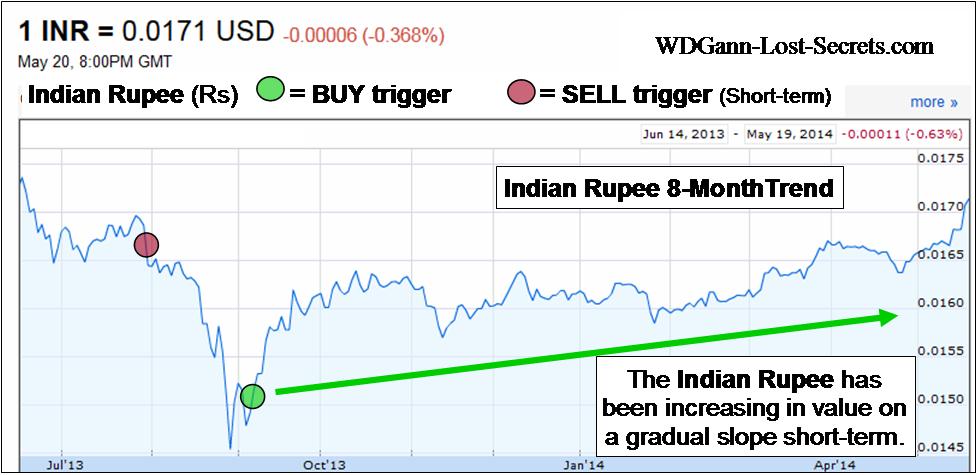 On a monthly basis, the Indian Rupee is rising in a steady, balanced fashion.
This is an important clue because, a solid, long-term rise needs to have a solid base price region.
This is best established by a slow, steady building of value (in India’s currency the Rupee in this case).
Should this process continue we’ll have the excellent pairing of a strong stock market backed by a strong currency.
This is a short-term rise from, what has been, a constant decline in the Rupee lasting 2- years now.
All downtrends, eventually turn into uptrends again.
Has the Indian Rupee made this turn?
Let’s look back a little bit further into the past to put this currency (and India’s economy) into better perspective.
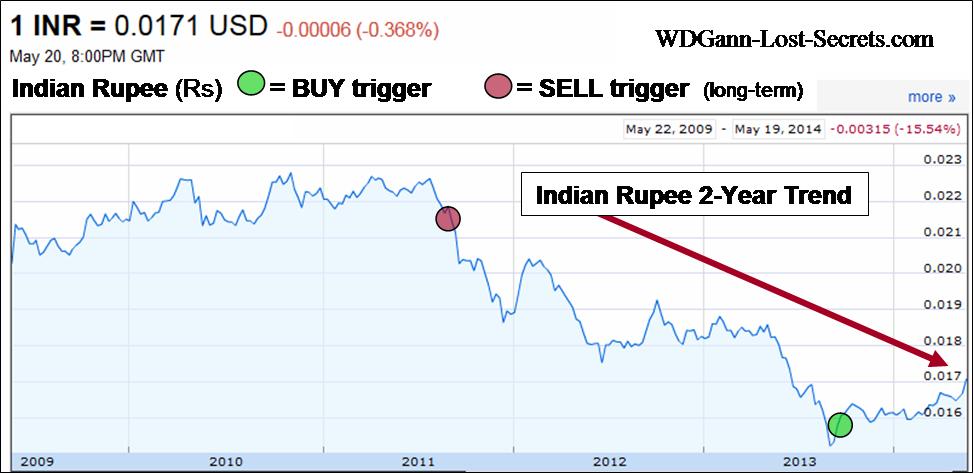 Now, let’s observe the last chart in our series now to see where we’re coming from up to the present.
The long-term momentum has been Down these last 2-years, but, the momentum has been slowing by shifting gradually upwards in price.
We’re getting quite close to a second break-out to the upside which would be a very early indicator of a long-term build-up for the Rupee.
What you’ve seen here and in the markets covered this week is how each nation’s markets can be accurately assessed and acted on early.
Understanding & finding these shifts without the special insights needed to do so can be almost impossibly difficult.
That is, unless one has a method of market analysis that can uncover these critical shifts in momentum even as they’re happening. Those critical early decision points are what’s illustrated on these charts with the red and green circles. See lower on the page to learn more about the Excalibur Method used on these charts. – George
NOTE that all charts show hypothetical decision points as part of this website’s educational content. All trading is risky. Please read the Disclaimers on this site.
